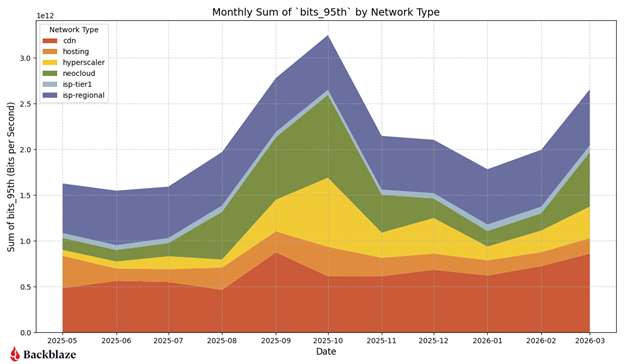
Backblaze Q1 2026 Network Stats: Neocloud Cools, CDN Climbs, Geography Comes into View by Lyle Smith on April 28, 2026 Enterprise ◇ Enterprise Storage Backblaze’s Q1 2026 Network Stats report shows a slower winter period for neocloud and hyperscaler traffic, with activity beginning to rise again in March. The report examines network-level infrastructure data across Backblaze’s environment, providing context on how data movement is changing as AI-related workloads continue to influence cloud and storage usage patterns. Since the launch of B2 Overdrive in April 2025, Backblaze has been tracking traffic between its storage layers and neocloud environments used for processing, inference, and modeling. In Q1, hosting and ISP traffic remained close to historical norms; CDN traffic increased over the winter months; and both neocloud and hyperscaler traffic followed a quieter winter pattern before trending upward toward the end of the quarter. Where Backblaze sent and received the most traffic The first set of heatmaps compares total bits transferred by Backblaze region and network type in Q1 2026 against Q4 2025. The pattern shows the US-West remaining the most active region for ISP-regional traffic, which Backblaze said was expected given the region’s larger infrastructure footprint and its connections to internet exchanges. The quarter-over-quarter change was more visible in CDN traffic. While neocloud and hyperscaler activity slowed during the winter period, traffic to CDN partners increased across US-West, US-East, and EU-Central. That shift suggests more data was moving through content delivery networks during the quarter, even as AI-adjacent neocloud and hyperscaler traffic cooled from the previous quarter’s higher levels. Data Transfers With the Most Magnitude (bits per IP Address) Backblaze’s next view looks at “magnitude,” or the amount of data transferred per IP address. It is a useful way to separate broad, distributed traffic from heavier point-to-point flows. When a large amount of traffic is distributed across many IPs, it is generally easier to balance the load across the network. When a large amount of traffic is concentrated across fewer IPs, it becomes more challenging from a network engineering standpoint because individual flows carry more weight. Even though total neocloud traffic declined during the winter months, the bits-per-IP view shows that neocloud transfers remained highly concentrated. That reflects how GPUs and compute clusters tend to move data: when ingesting datasets or producing outputs, they can push high-bitrate traffic through a relatively small number of endpoints. Backblaze said the strongest concentration remained around its US-East cluster, with additional increases showing up in US-West and EU-Central, setting up a closer look later in the report at where neocloud traffic is coming from geographically. How Many Unique Addresses Backblaze Interacts With The unique-address view adds another layer to the traffic picture by showing how many distinct IP addresses Backblaze interacted with across each network type. In this case, the Q1 2026 heatmap looks very similar to Q4 2025, which supports the idea that the underlying dataset remained consistent even as traffic volumes shifted during the winter period. US-West continued to show the highest overall uniqueness, largely because it is Backblaze’s most mature region and supports a wider mix of data centers, workloads, and ISP-regional traffic. Neocloud traffic looked different, with fewer and more persistent endpoints involved. That fits the pattern Backblaze has been describing throughout the report: AI-related storage and compute flows often move large amounts of data between stable endpoints, creating the kind of “elephant flows” that stand out more clearly when traffic is measured by concentration rather than just total volume. Seasonal Change in Traffic Flows Backblaze’s summary view shows how the winter slowdown changed the overall traffic mix in Q1 2026. With neocloud and hyperscaler traffic easing from the previous quarter, CDN traffic became a much larger share of total network activity, rising from roughly 20% in Q4 2025 to 32% in Q1 2026. Localized ISP-regional traffic also grew as a share of the total, increasing from 21.5% to 27.8%. At the same time, neocloud and hyperscaler traffic together fell from 36.4% in Q4 2025 to 25.5% in Q1 2026. AI-adjacent traffic did not disappear, but it accounted for a smaller share of Backblaze’s network activity during the quieter winter period, while CDN and regional ISP traffic filled the gap more. Backblaze’s report then shifts from network type to geography, examining where traffic is concentrated across Backblaze’s infrastructure. In March 2026, Backblaze added geographic information to its dataset for the first time, allowing the company to break down traffic concentration by location and network type. The analysis looks at three views: global traffic by country, country-level traffic excluding the United States, and traffic across U.S. states. Highest Concentration of Traffic by Network Type (Countries) The first geographic heatmap shows traffic concentration by network type across the top 20 countries in March 2026. Across neocloud, hyperscaler, and CDN traffic, the United States stands out clearly as the largest concentration point in Backblaze’s dataset. That concentration may reflect a mix of Backblaze’s own infrastructure footprint, with US-West and US-East serving as two of its largest deployments, and the broader shape of the AI infrastructure market. The U.S. remains a major hub for data center capacity, so it is not surprising that network-level traffic tied to cloud, CDN, and neocloud activity would cluster heavily there as well. Highest Concentration of Traffic by Network Type (Countries, Excluding US) With the United States removed from view, the second heatmap provides a clearer picture of where international traffic is concentrated. The Netherlands stands out for CDN traffic, which Backblaze links in part to its connectivity with AMS-IX, the Amsterdam Internet Exchange. That reflects a broader difference in European network design, where local internet exchanges often play a larger role than major Tier 1 transit providers because of cost, routing preferences, and regional network politics. Other international patterns also come into focus in the ex-U.S. view. Singapore shows notable CDN activity, while Germany appears more prominently in hosting traffic. The neocloud category is more scattered, with visible concentrations in Finland, Brazil, France, and Canada. That spread suggests AI-related data movement outside the U.S. is not centered on a single market but is beginning to appear across several regions with meaningful cloud, compute, or connectivity footprints. The U.S. state-level heatmap further narrows the geographic view and shows neocloud traffic is heavily concentrated in California. That lines up with the broader pattern in the report, where AI-related data flows tend to cluster around regions with dense compute, cloud, and connectivity infrastructure. Hyperscaler traffic shows a more expected split, with California and Virginia standing out. Virginia’s presence is especially notable because of the Ashburn-Reston corridor, one of the country’s major cloud and data center hubs. CDN traffic, meanwhile, is more concentrated within Backblaze’s footprint, particularly in its US-West region, its largest and longest-running cluster. That makes it more likely to serve older, longer-lived content from those sites, giving the region a stronger role in CDN-related traffic. Highest Concentration of Traffic by NetworkType ( ) The U.S. state-level heatmap further narrows the geographic view and shows neocloud traffic is heavily concentrated in California. That lines up with the broader pattern in the report, where AI-related data flows tend to cluster around regions with dense compute, cloud, and c...